
HBV
Global high-resolution parameter maps
Overview
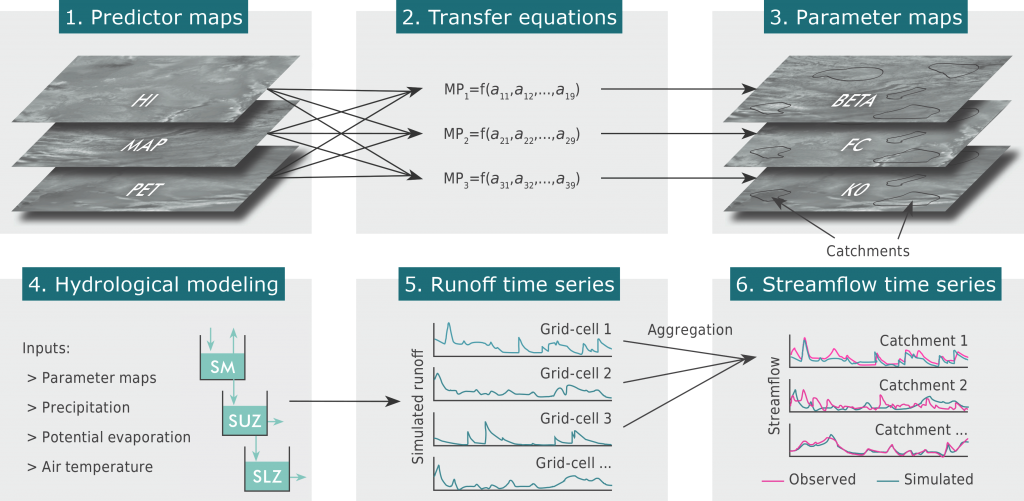
- Beck, H. E., Pan, M., Lin, P., Seibert, J., van Dijk, A. I. J. M., and Wood, E. F. (2020)Global fully distributed parameter regionalization based on observed streamflow from 4,229 headwater catchmentsJournal of Geophysical Research: Atmospheres, 125, e2019JD031485
Download
Acknowledgements
Frequently asked questions
Runoff projections from HBV with regionalized parameters are probably in most cases more reliable than those from HBV with unoptimized parameters. The following caveats should, however, be kept in mind. First, since the regionalized parameters were optimized to produce better runoff simulations, they do not necessarily represent hydrological processes more realistically. Secondly, the validity of the regionalized parameters, which were optimized using historic climate conditions, may be less under significantly different future climate conditions. See Vaze et al. (2010) and Fowler et al. (2020) for further discussion.
The ten sets of global parameter maps represent different cross-validation folds, meaning they were derived from slightly different (but overlapping) subsets of catchments. All ten sets of parameter maps are equally uncertain and therefore should produce equally “good” simulations. Ideally, all ten sets of parameter maps would be used in an ensemble modeling framework to obtain an ensemble of outputs, the spread of which provides an indication of the parameter uncertainty. See McIntyre et al. (2005) and Yang et al. (2011) for more discussion on ensemble modeling.
Interactions between model parameters and simulation results are generally highly complex and nonlinear. The outputs of a low-resolution model with resampled parameter maps will therefore likely significantly differ from the resampled outputs of a high-resolution model with 0.05° parameter maps. Thus, we do not recommend using the parameter maps at other spatial resolutions. See Beven (1995), Kling and Gupta (2009), and Freund et al. (2020) for further discussion.